
The International Organisation of Vine and Wine (OIV) has recently indicated that the 2018-vintage global wine production is "back to normal" in size (Global wine harvest bounces back).
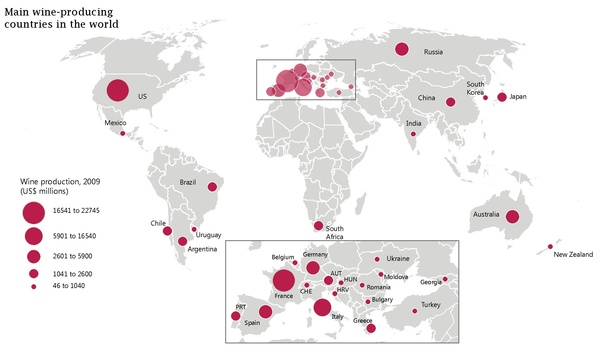
However, a year ago the OIV reported that the 2017 global wine production had fallen to its lowest level since the beginning of the 1960s. This decrease was the result of the inclement weather that extensively damaged vineyards in the world’s largest production area, western Europe (containing the world's three biggest producers: Italy, France and Spain).
As always, I wanted a picture of what it looks like to have "the lowest production for 60 years". Is this decrease only a little bit lower than the past few decades or a lot lower? A graph would obviously answer this for me. However, finding this graph turned out to be much more difficult that I thought. I expected that somewhere there would be a graph of annual global wine production, stretching back for decades, but I turned out to be badly wrong.
The trusty Statistical Compendium presents the production data averaged across each decade, only (this was graphed on the AAWE Facebook page after I started writing this post); and the OIV online data go back only to 1995. At least the FAO online data go back to 1961, although it is measured in tonnes of grape must not liters of wine.
Production
Eventually, Kym Anderson (of the University of Adelaide) kindly pointed out to me that the spreadsheet associated with the Statistical Compendium does actually have the annual data, all the way back to 1860. So, here is the graph that I have been looking for, with global wine production shown vertically (a hectoliter is 100 liters — for comparison, a dozen standard bottles of wine is 9 liters), and time proceeding horizontally. The pink line shows the 2017 production level compared to recent decades.

Obviously, there was a slow increase in production until World War II, with a big dip in production during the war itself. In contrast, there was a dip for only one year during World War I, although that year (1915) had the lowest production after 1863. After the second war, there was a rapid increase in production until 1980, followed by a decline until 1990. Production has remained steady since then.
As far as the 2017 production is concerned, all production levels prior to 1962 were lower (ie. 55 years earlier). However, both 1991 and 2002 came close to the 2017 level.
This result differs somewhat from the OIV reports, which originally agreed with this but then changed their previous low year to 1957 (eg. World wine output falls to 60-year low). However, the OIV values are an average of 5 million hectoliters greater than the values shown here.
Consumption
This graph leads to the obvious question about wine consumption. After all, we have been told for several decades about a so-called "wine lake" caused by world-wide over-production. Indeed, in the past the EU paid to have excess wine converted to spirits, and more recently it has been paying grape-growers to pull up vines, especially in southern France. The government of South Australia tried the same vine-pull tactic back in the late 1980s.
Here is the graph that compares consumption with production, as recorded in the Statistical Compendium spreadsheet.

This shows that consumption kept close pace with production until 1963, although the relevant consumption is usually the year (or two) after production (since the wines do not appear on the shelves until then).
After 1963, production has almost always exceeded consumption. This is the origin of the wine lake — indeed, in some years production far exceeded consumption. Both consumption and production dipped towards the end of last century, which is when the various governments started to address over-production. Since then, consumption has slowly increased again, although production has continued to exceed consumption. However, the two levels were very close in both 2012 and 2017.
Supply and demand caused concern in 2013, when it was reported by Morgan Stanley that "an excess of 600 million unit cases (almost one quarter of global consumption) in 2004, [was] reduced to just 1 million unit cases in 2012." At that time, it was suggested that "there's little indication that world production can keep pace with the oenophilic hordes."
The production levels of 2013–2016 eased this situation. However, the low production in 2017 has once again led to reports of a sharp decline in French wine inventories.
By David Morrison
November 19, 2018
Source: Winegourd.blogspot.com