Posted: Oct 01, 2017
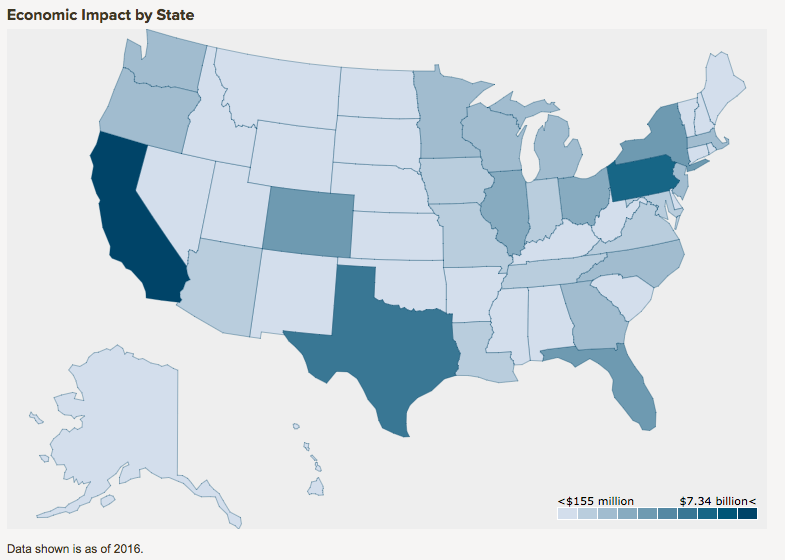
The drinks business rounds up the top 10 US states for craft beer in 2016 based their economic output, with data supplied by the industry group Brewers Association.
The data was compiled by the Brewers Association via via its annual ‘Beer Industry Production Survey’ (BIPS) and the bi-annual ‘Brewery Operations Benchmarking Survey’ (BOBS) as well as additional government and market data and relates to ‘small and independent American craft brewers.’
The Brewers Association define ‘small’ as ‘annual production of six million barrels of beer or less’ and ‘independent’ as a brewery that is ‘less than 25% owned or controlled (or equivalent economic interest) by an alcohol industry member that is not itself a craft brewer.’
Economic output is defined as the ‘total impact of beer brewed by craft brewers as it moves through the three-tier system’ – meaning from breweries, to wholesalers and finally to retailers – as well as ‘non-beer products like food and merchandise’ that is sold directly from brewpub eateries, taprooms and shops.
As part of its report, the Brewers Association found that US craft beer contributed $67.8 billion to the economy as well as providing 456,373 full-time equivalent jobs, a 7.5% increase from the figure recorded in 2014 which was the last time such a report was published by the organisation.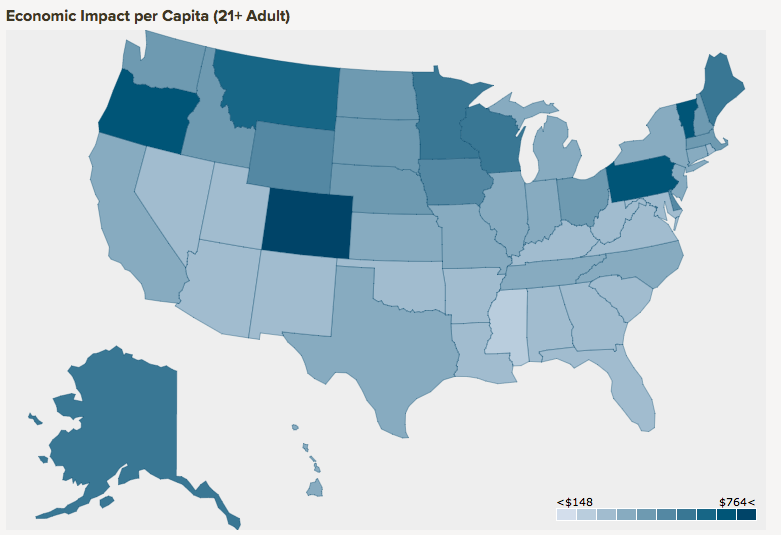
Source: Brewers Association
2016 State economic contribution per capita rankings
Go-Wine's mission is to organize food and beverage information and make it universally accessible and beneficial. These are the benefits of sharing your article in Go-Wine.com


The Wine Thief Bistro & Specialty Wines is a locally owned small business in downtown Frankfort, IL offering world class wines in a relaxed, casual gathering spot for friends and family. Offering world class virtual tastings and touchless carryout.
https://www.twtwineclub.com/aboutus
Go-Wine 25 Great Wineries in US selection prioritizes quality, value and availability.
www.go-wine.com/great-wineries-in-america
Tasting wine is a nice experience, but visiting the places in which wine is made is a magic moment. Available in New York City for touchless pickup.